Now that all the data logging hardware was sorted, I just had to adjust the settings in Radio Skypipe to produce the chart and data that is easy to read and see. The really noisy graphs produced so far could be improved upon.
Once again I set up my telescope, pointed at the sun, and then moved it to where it was going to be moving and started recording on the computer.
 |
| First Measurement |
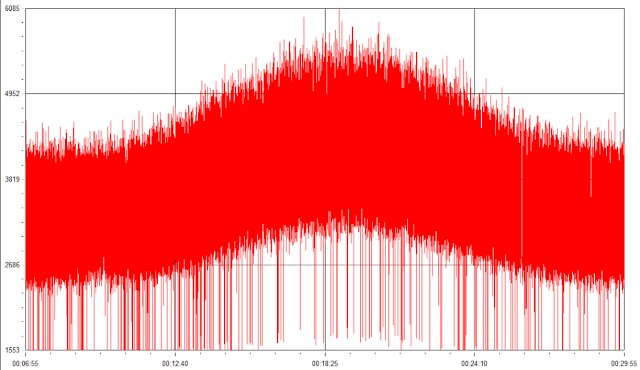
My first measurement was too noisy with far too many data points. The large, thick line of the graph is really hard to read.
 |
| Second Measurement |
I adjusted and played with sample and averaging rates until I got a response curve I was happy with.
 |
| Third Measurement |
Getting better.
 |
| Fourth Measurement |
Much better
 |
| Fifth Measurement |
Success! This is what I was looking for. A nice, easy to read response curve from my telescope showing the sun move across the front of the dish. You can see from the graph it took the sun about 13 minute to move across the dish.
 |
| Sixth Measurement |
I took a sixth measurement and left it for a longer period of time to get a bigger picture of what is happening. As you can see, there are two peaks to the graph. I think that might be because of some side lobes on the dish. Not quite sure. Interesting response. You can clearly see the sharp roll off once the sun moves over the dish.
Very happy with these measurements. I managed to get my telescope working well, and producing results that are satisfactory to me and easily readable. Much better than the noisy graphs it was first producing.


Comments
Post a Comment